Dashboard
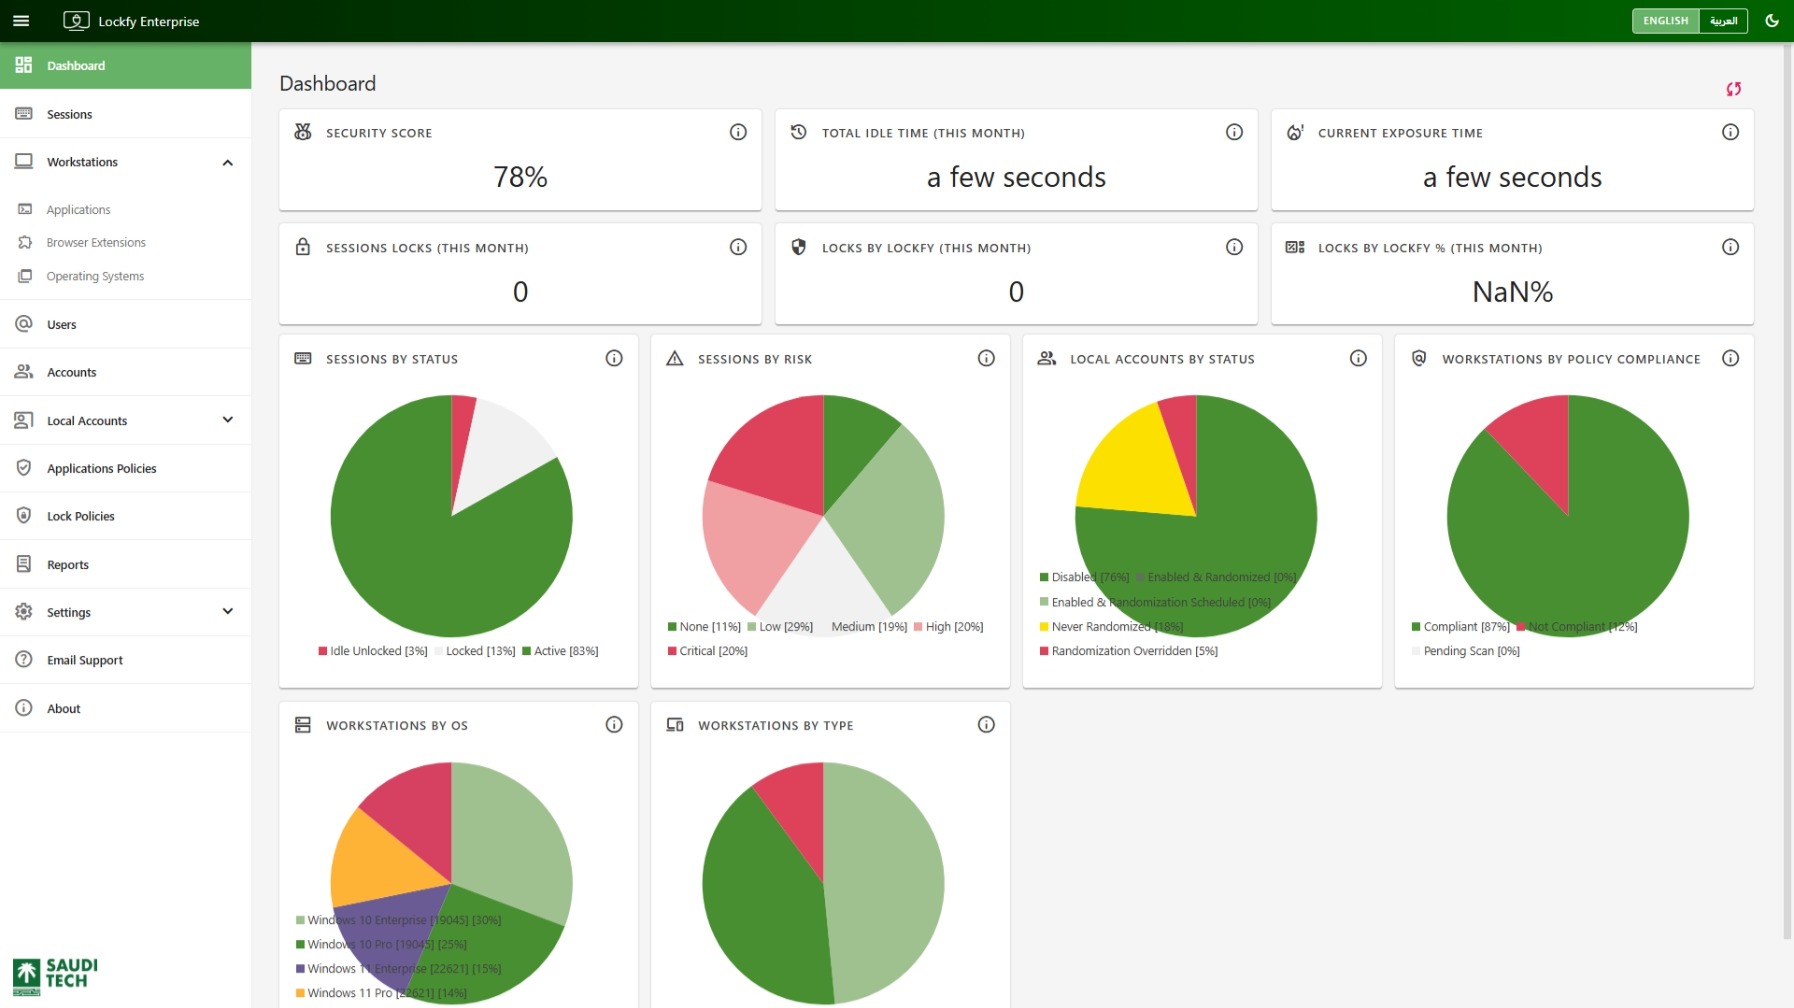
The dashboard is the starting point for day-to-day monitoring in Lockfy. It combines numeric widgets and charts to summarize exposure, compliance, session state, and endpoint distribution across the environment.
Security Score
Section titled “Security Score”The Security Score is a weighted summary of overall workstation security posture. By default, it is influenced by three major factors:
- Idle and unlocked sessions.
- Non-compliant workstations.
- Enabled local accounts.
Use this widget as a directional indicator. It helps you identify whether exposure is improving or deteriorating over time, but it should always be interpreted alongside the underlying widgets that explain why the score changed.
If you need to change how this score is calculated, review Dashboard Settings.
Total Idle Time (This month)
Section titled “Total Idle Time (This month)”This widget shows the cumulative amount of idle time recorded across all sessions during the current calendar month. It represents how long devices remained unused before being locked, signed out, or reactivated.
Higher values may indicate that lock policies should be reviewed or tightened, especially if those idle periods occur on higher-risk systems or accounts.
Related pages: Sessions Overview and Lock Policies List.
Current Exposure Time
Section titled “Current Exposure Time”Current Exposure Time shows the amount of idle and currently unlocked session time that still exists right now across the environment. Unlike monthly totals, this is a live indicator of present exposure.
Sessions Locks (This Month)
Section titled “Sessions Locks (This Month)”This widget shows the total number of times sessions were locked during the current calendar month, across all lock sources (GPO, user-initiated, and Lockfy).
Locks by Lockfy
Section titled “Locks by Lockfy”This widget shows how many times Lockfy actively locked sessions during the current calendar month.
Locks by Lockfy %
Section titled “Locks by Lockfy %”This widget shows the percentage of session locks performed by Lockfy compared to all other lock types during the current calendar month.
Sessions by Status
Section titled “Sessions by Status”This chart groups sessions into three states:
- Idle and unlocked.
- Locked.
- Active.
The goal is to minimize idle and unlocked sessions, since those represent the most immediate opportunity for misuse.
Sessions by Risk
Section titled “Sessions by Risk”Lockfy classifies session risk using five levels: None, Low, Medium, High, and Critical.
Session risk is derived from the highest risk assigned to the following related objects:
- The workstation.
- The account.
- The user.
The effective session risk always matches the highest contributing risk value.
To investigate the contributing objects directly, review Workstation Details, Account Details, and User Details.
Example 1
Section titled “Example 1”A low-risk user signing in with a low-risk account on a high-risk workstation results in a high-risk session.
Example 2
Section titled “Example 2”A low-risk user signing in with a critical-risk account on a low-risk workstation results in a critical-risk session.
Local Accounts by Status
Section titled “Local Accounts by Status”This chart shows whether discovered local accounts are enabled or disabled across the environment.
Workstations by Policy Compliance
Section titled “Workstations by Policy Compliance”This chart summarizes workstation compliance against the assigned application policy. Workstations are typically shown as:
- Compliant.
- Not compliant.
- Pending scan.
To review the policy logic behind these values, see Applications Policies List.
Workstations by Operating System (OS)
Section titled “Workstations by Operating System (OS)”This chart shows the most common operating systems and builds currently reported by managed workstations.
Workstations by Type
Section titled “Workstations by Type”This chart shows how managed endpoints are distributed by device type:
- Desktop.
- Laptop.
- Server.